Endlessly curious with analysis experience in economic forecasting, real estate, and marketing. Fascinated by AI and building my own task agents with LangChain & Python. Offline, an enthusiast of national parks, history audiobooks, and doting over my three old, fat, happy doggies.
PL-300 | ID 3D25D4746DA0FDAF | 3/11/2023
AZ-104 | ID 2A6B136CE7F6AF45 | 3/22/2023
AZ-900 | ID 9373B6916A998E0 | 3/12/2023
MS-900 | ID 54F221314D69098A | 3/1/2023
PL-900 | ID 7203A01E48D3106C | 2/24/2023
2/20/2023
Inquire for full list.
A Tableau dashboard examining the patterns of US flight delays in 2015. The visualization features maps, bar charts, area charts, and histograms to compare delay types and distributions across different airlines and airports.
Skills: Tableau, Excel, Data Visualization
Open Dashboard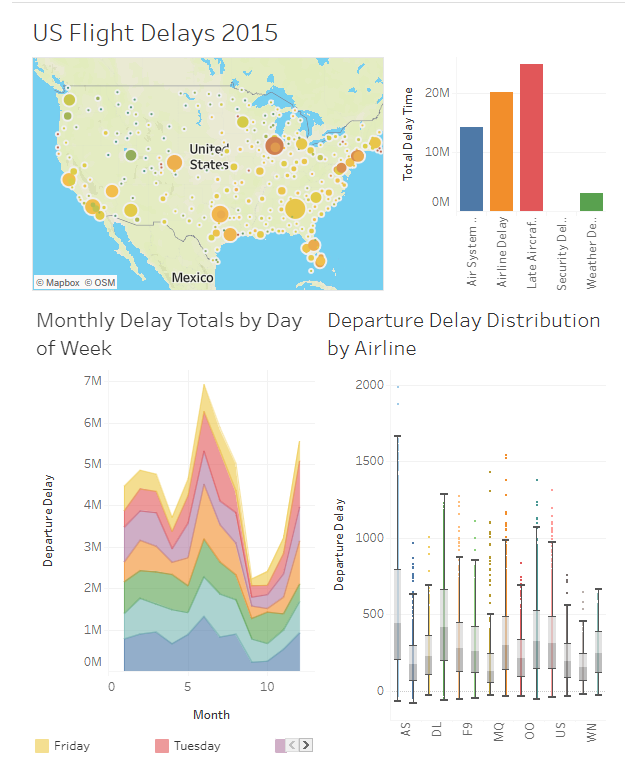
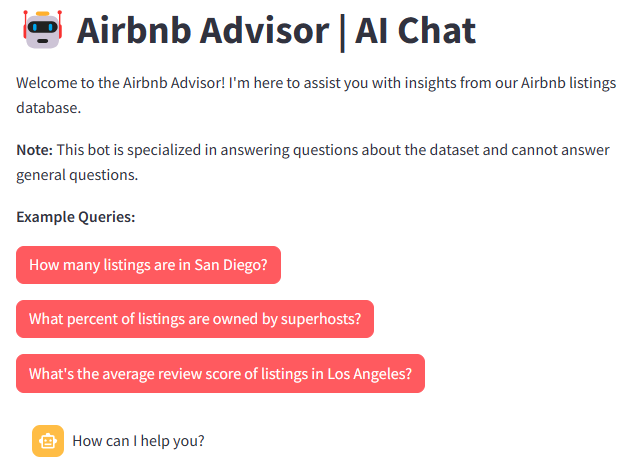
Interactive multi-page Streamlit app featuring mini dashboards filterable by city, SQL exploration page, map visualization, and a chat-based AI agent for database Q&A with real-time processing and robust error handling. Derived from Inside Airbnb datasets across US metros. Backend is powered by a custom SQLAlchemy model, OpenAI API integration, NLP, and complex Python scripting.
Skills: Python, SQLite, API Integration, Web Design, LangChain, Data Visualization
Launch App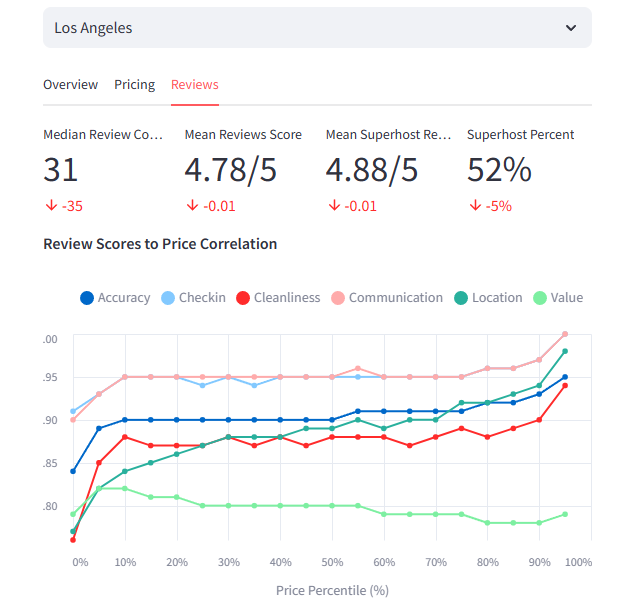
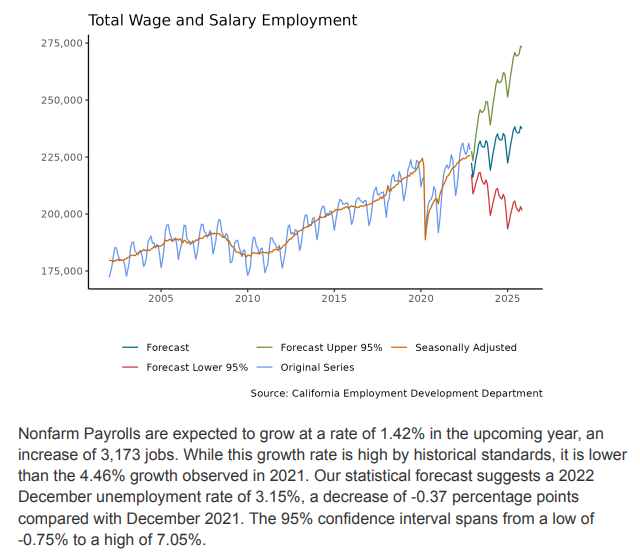
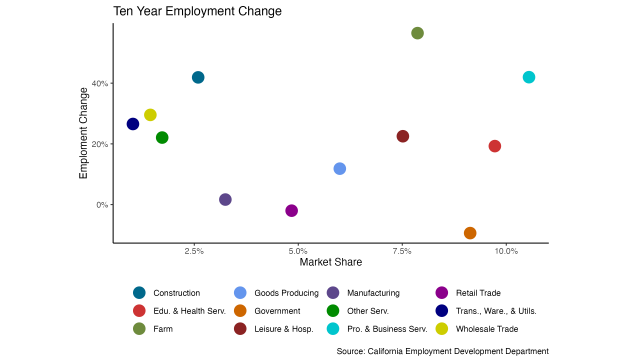
A comprehensive 40-page report detailing employment and income trends in Santa Barbara MSA and California. Contains ARIMA forecasts predicting sustained post-pandemic recovery across most industries. Presents thorough written analysis, SQL query-derived metrics, plus visualizations through Python and R, diving deep into economic figures. A go-to resource for local consultants and economists, aiding them in understanding local and state trends to aid in making informed recommendations.
Skills: Python, R, SQL, Data Visualization, API Integration, Data Processing
View Report